Set up tracing for your kagent agents.
Before you begin#
Install Jaeger#
Install a tracing tool, such as Jaeger. The following example installs Jaeger in all-in-one mode so that you can try out basic tracing capabilities without needing to install any other components.
-
Create a
jaeger.yamlconfiguration file.cat << 'EOF' > jaeger.yamlprovisionDataStore:cassandra: falseallInOne:enabled: truestorage:type: memoryagent:enabled: falsecollector:enabled: falsequery:enabled: falseEOF -
Install Jaeger.
helm repo add jaegertracing https://jaegertracing.github.io/helm-chartshelm repo updatehelm upgrade --install jaeger jaegertracing/jaeger \--namespace jaeger \--create-namespace \--history-max 3 \--values jaeger.yaml \--version 4.4.7
Upgrade kagent#
Upgrade your kagent Helm release to enable tracing.
-
Get your current Helm release values.
helm get values kagent -n kagent > values.yaml -
In the values file, enable tracing with the following settings.
otel:tracing:enabled: trueexporter:otlp:endpoint: http://jaeger.jaeger.svc.cluster.local:4317 -
Upgrade the kagent Helm chart with the tracing details.
helm upgrade -i kagent oci://ghcr.io/kagent-dev/kagent/helm/kagent \--namespace kagent \--values values.yaml
Trace your first agent#
Now that you installed kagent with Jaeger, learn how to trace requests to an agent.
Generate tracing data#
To generate tracing data, you can chat with a pre-configured agent such as k8s-agent. For more information about agents, see the Your First Agent guide.
-
Launch the kagent dashboard.
kagent dashboardExample output:
kagent dashboard is available at http://localhost:8082Press Enter to stop the port-forward...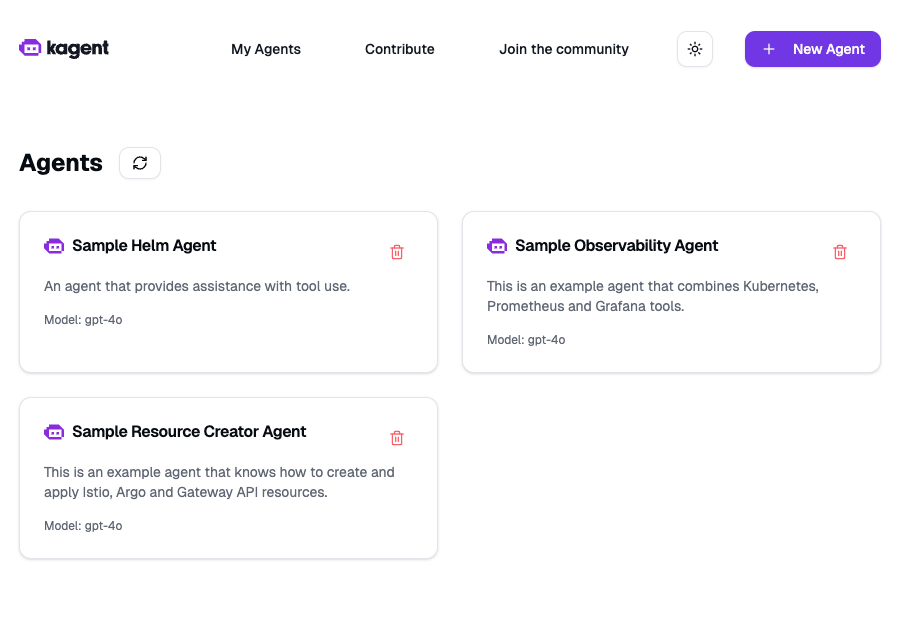
kagent dashboard main page -
Click the pre-configured
k8s-agentagent. -
In the conversation box, enter a query such as "What pods are running in my cluster?".

Chatting with an agent
Review tracing data in Jaeger#
Review the tracing data in Jaeger for the agent queries that you just sent.
-
In your terminal, enable port-forwarding for the Jaeger service.
kubectl port-forward -n jaeger svc/jaeger 16686:16686 -
In your browser, open the Jaeger UI: http://localhost:16686.
-
From the Jaeger Search menu, in the Service dropdown, select the
kagentservice. -
In the Operation dropdown, select
agent_run [k8s-agent]to filter for traces specific to the agent. -
Click Find Traces.
-
Review the traces for the
kagentservice.
Jaeger results page -
Click on a trace to see more details.

Jaeger trace details
That's it! You've now traced your first agent.
Next Steps#
- Learn about Core Concepts
- Try out some Example guides
Need Help?#
- Visit our GitHub repository
- Ask a question on Discord
- Check out the FAQ