For the complete documentation index, see llms.txt. Markdown versions of all docs pages are available by appending .md to any docs URL.
Tracing
Install Jaeger, turn on OpenTelemetry tracing in the kagent Helm release, then inspect a trace for a single agent request.
Set up tracing for your kagent agents.
Before you begin
Install Jaeger
Install a tracing tool, such as Jaeger. The following example installs Jaeger in all-in-one mode so that you can try out basic tracing capabilities without needing to install any other components.
Create a
jaeger.yamlconfiguration file.cat << 'EOF' > jaeger.yaml provisionDataStore: cassandra: false allInOne: enabled: true storage: type: memory agent: enabled: false collector: enabled: false query: enabled: false EOFInstall Jaeger.
helm repo add jaegertracing https://jaegertracing.github.io/helm-charts
helm repo update
helm upgrade --install jaeger jaegertracing/jaeger \
  --namespace jaeger \
  --create-namespace \
  --history-max 3 \
  --values jaeger.yaml \
  --version 4.4.7
Upgrade kagent
Upgrade your kagent Helm release to enable tracing.
Get your current Helm release values.
helm get values kagent -n kagent > values.yamlIn the values file, enable tracing with the following settings.
otel:
  tracing:
    enabled: true
    exporter:
      otlp:
        endpoint: http://jaeger.jaeger.svc.cluster.local:4317
Upgrade the kagent Helm chart with the tracing details.
helm upgrade -i kagent oci://ghcr.io/kagent-dev/kagent/helm/kagent \
    --namespace kagent \
    --values values.yaml
Trace your first agent
Now that you installed kagent with Jaeger, learn how to trace requests to an agent.
Generate tracing data
To generate tracing data, you can chat with a pre-configured agent such as k8s-agent. For more information about agents, see the Your First Agent guide.
Launch the kagent dashboard.
kagent dashboardExample output:
kagent dashboard is available at http://localhost:8082
Press Enter to stop the port-forward...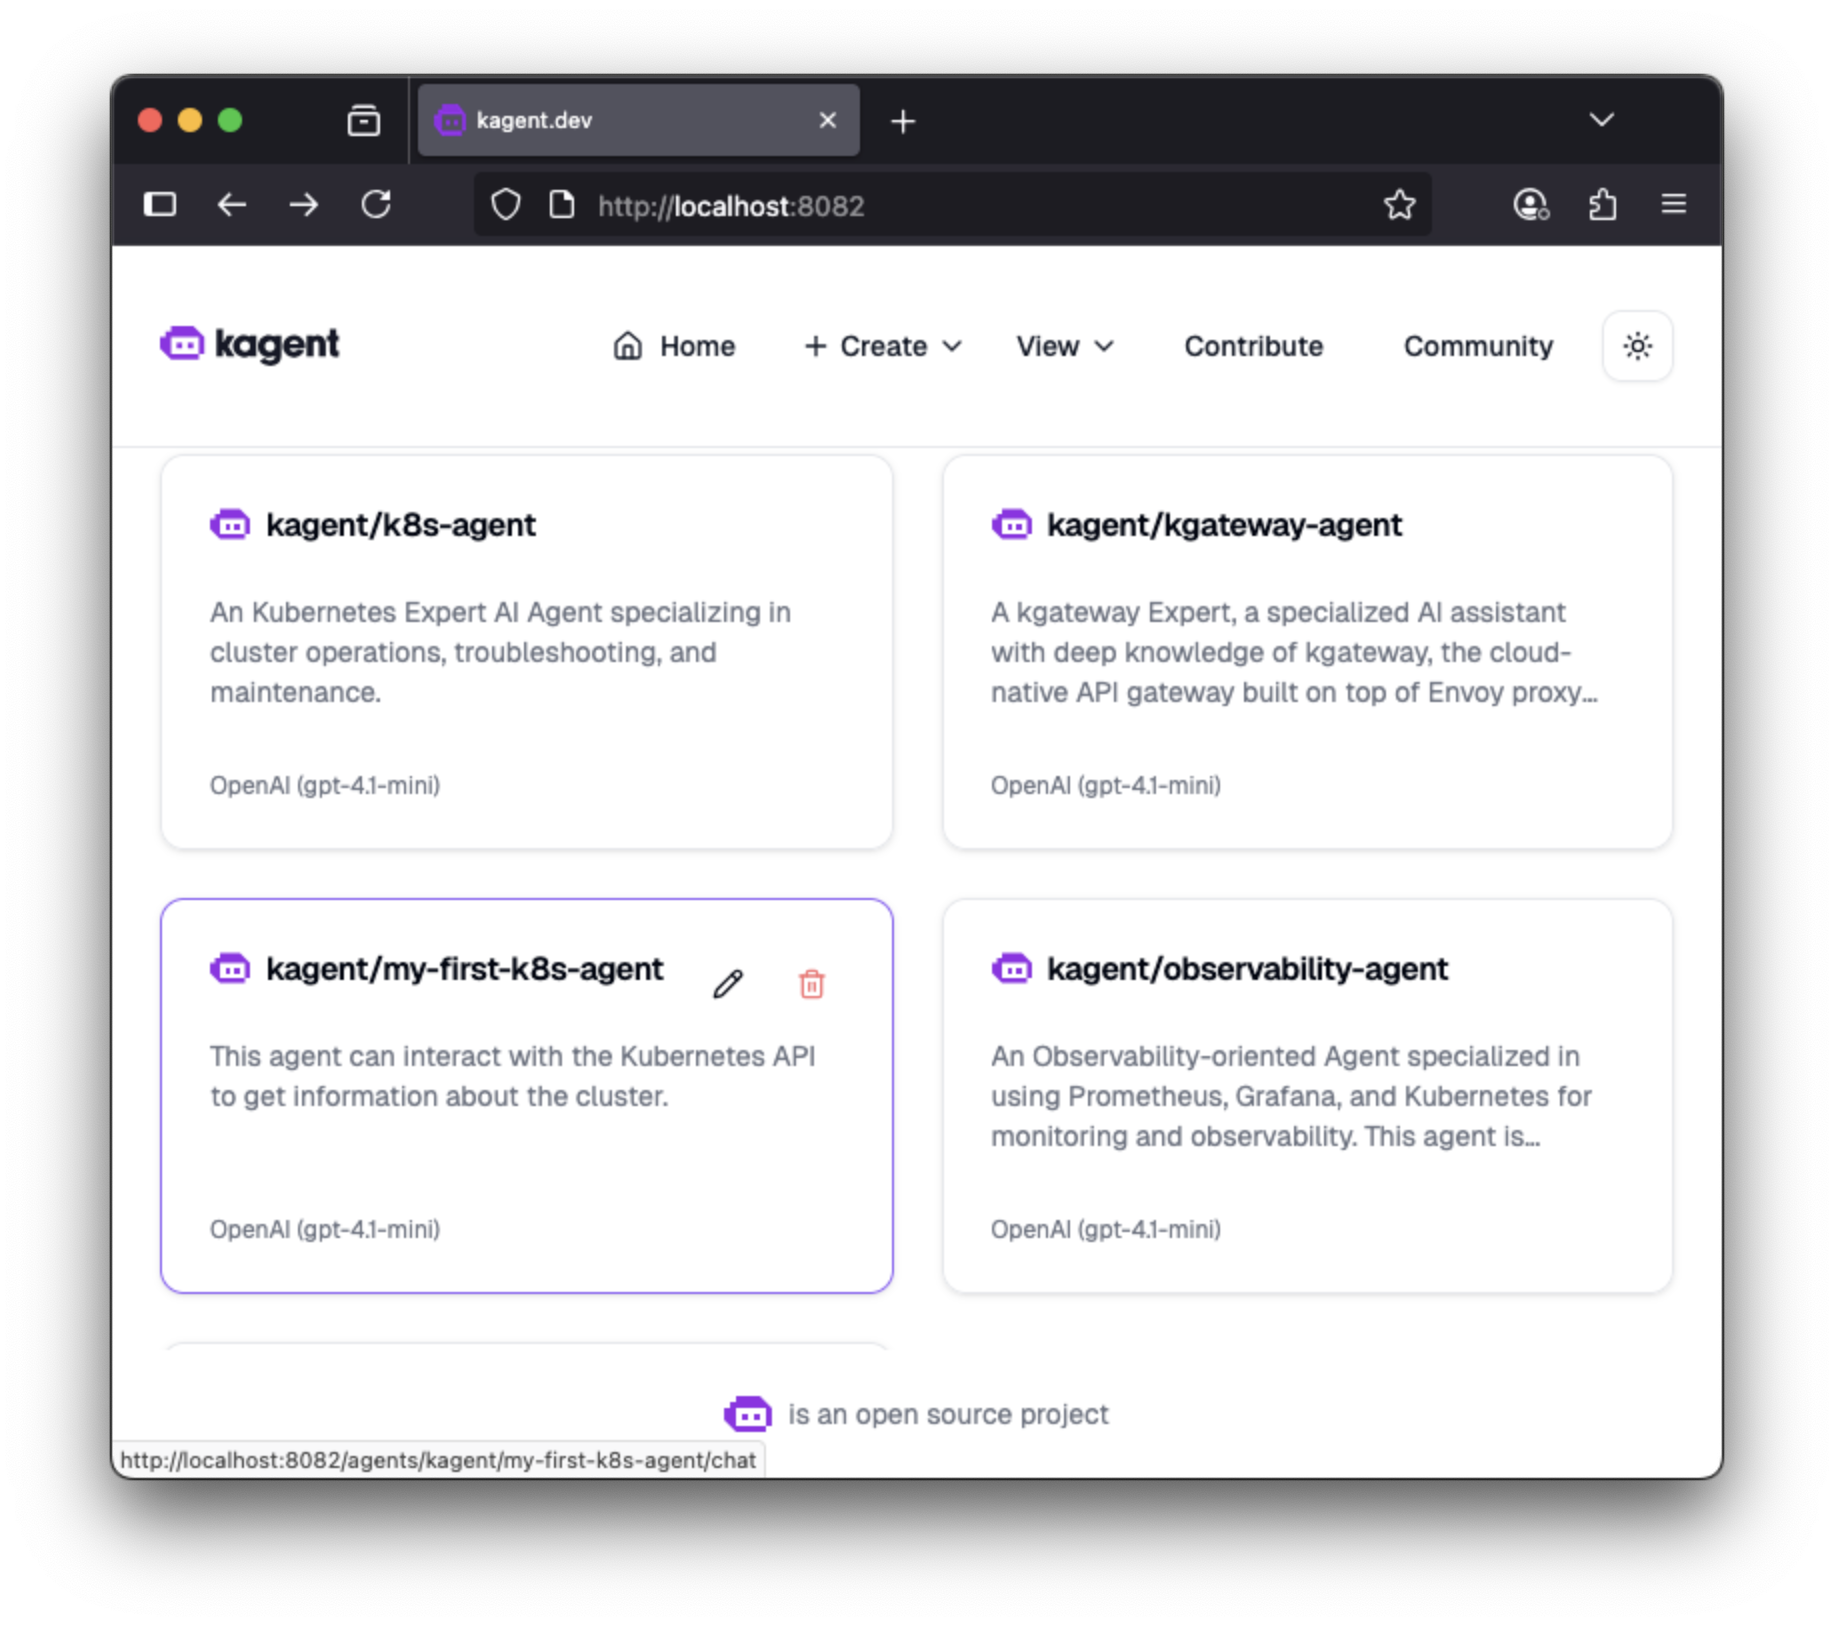
kagent dashboard main page Click the pre-configured
k8s-agentagent.In the conversation box, enter a query such as “What pods are running in my cluster?”.
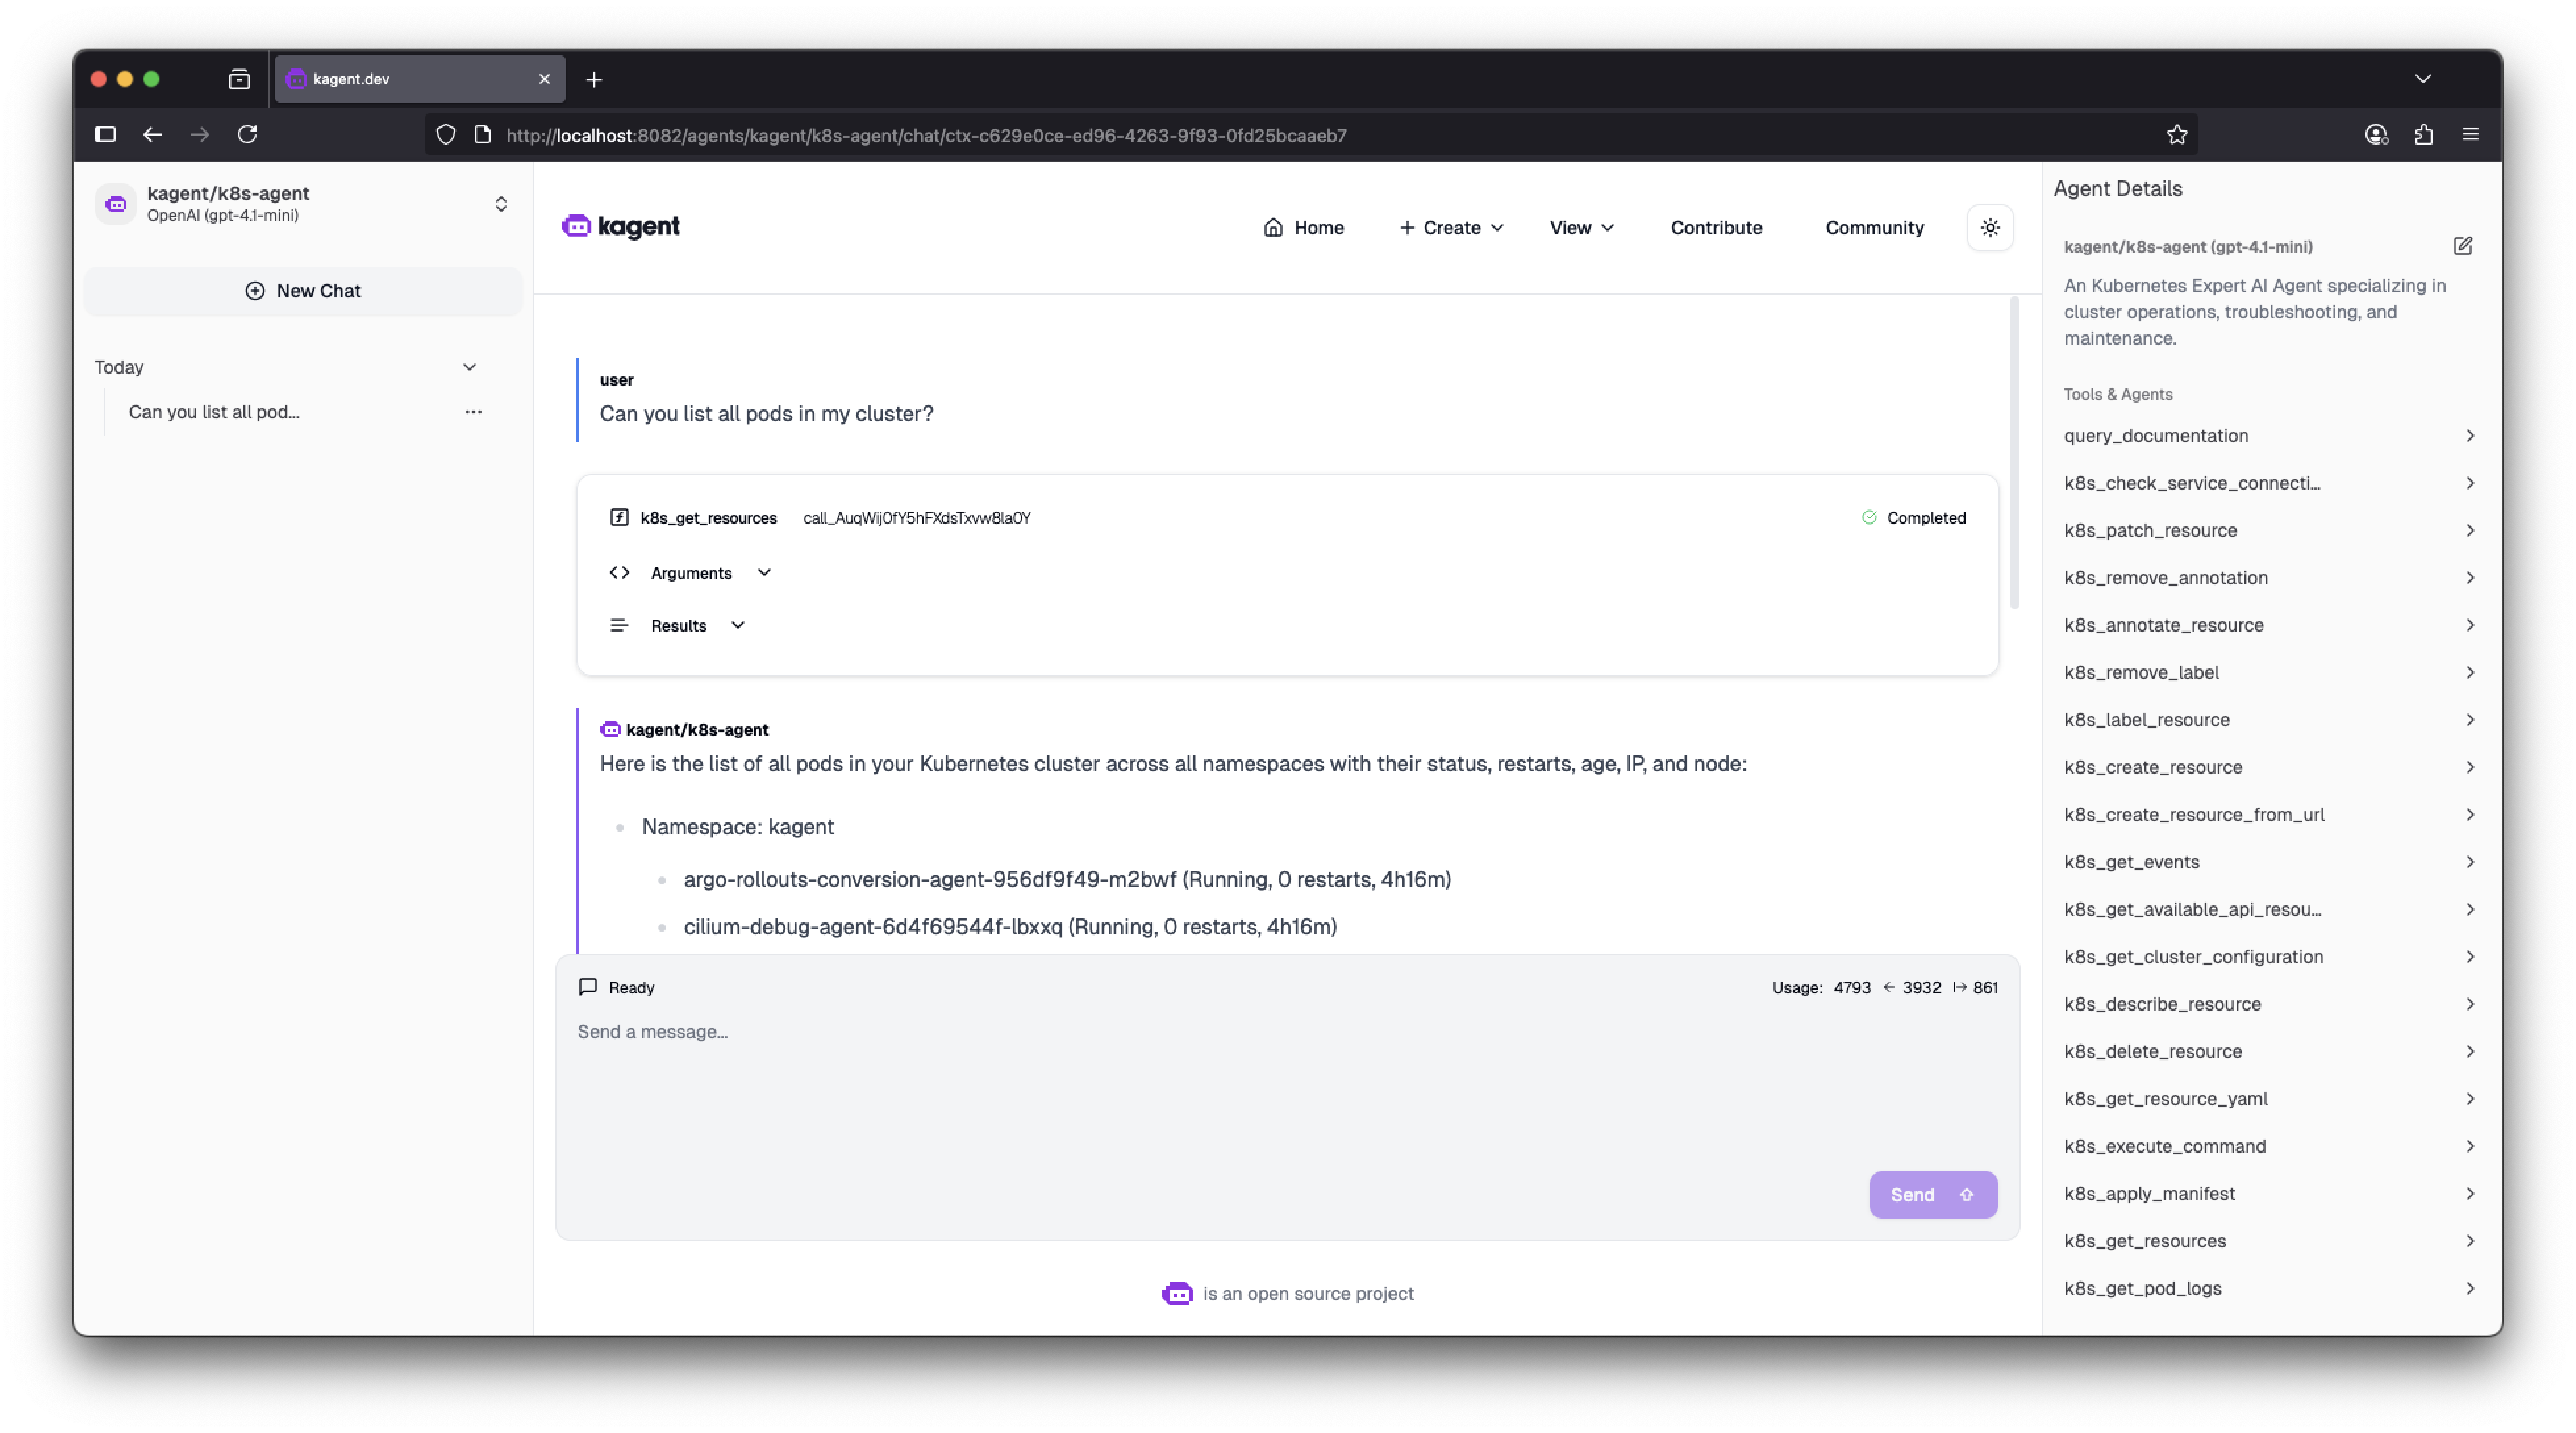
Chatting with an agent
Review tracing data in Jaeger
Review the tracing data in Jaeger for the agent queries that you just sent.
In your terminal, enable port-forwarding for the Jaeger service.
kubectl port-forward -n jaeger svc/jaeger 16686:16686In your browser, open the Jaeger UI: http://localhost:16686.
From the Jaeger Search menu, in the Service dropdown, select the
kagentservice.In the Operation dropdown, select
agent_run [k8s-agent]to filter for traces specific to the agent.Click Find Traces.
Review the traces for the
kagentservice.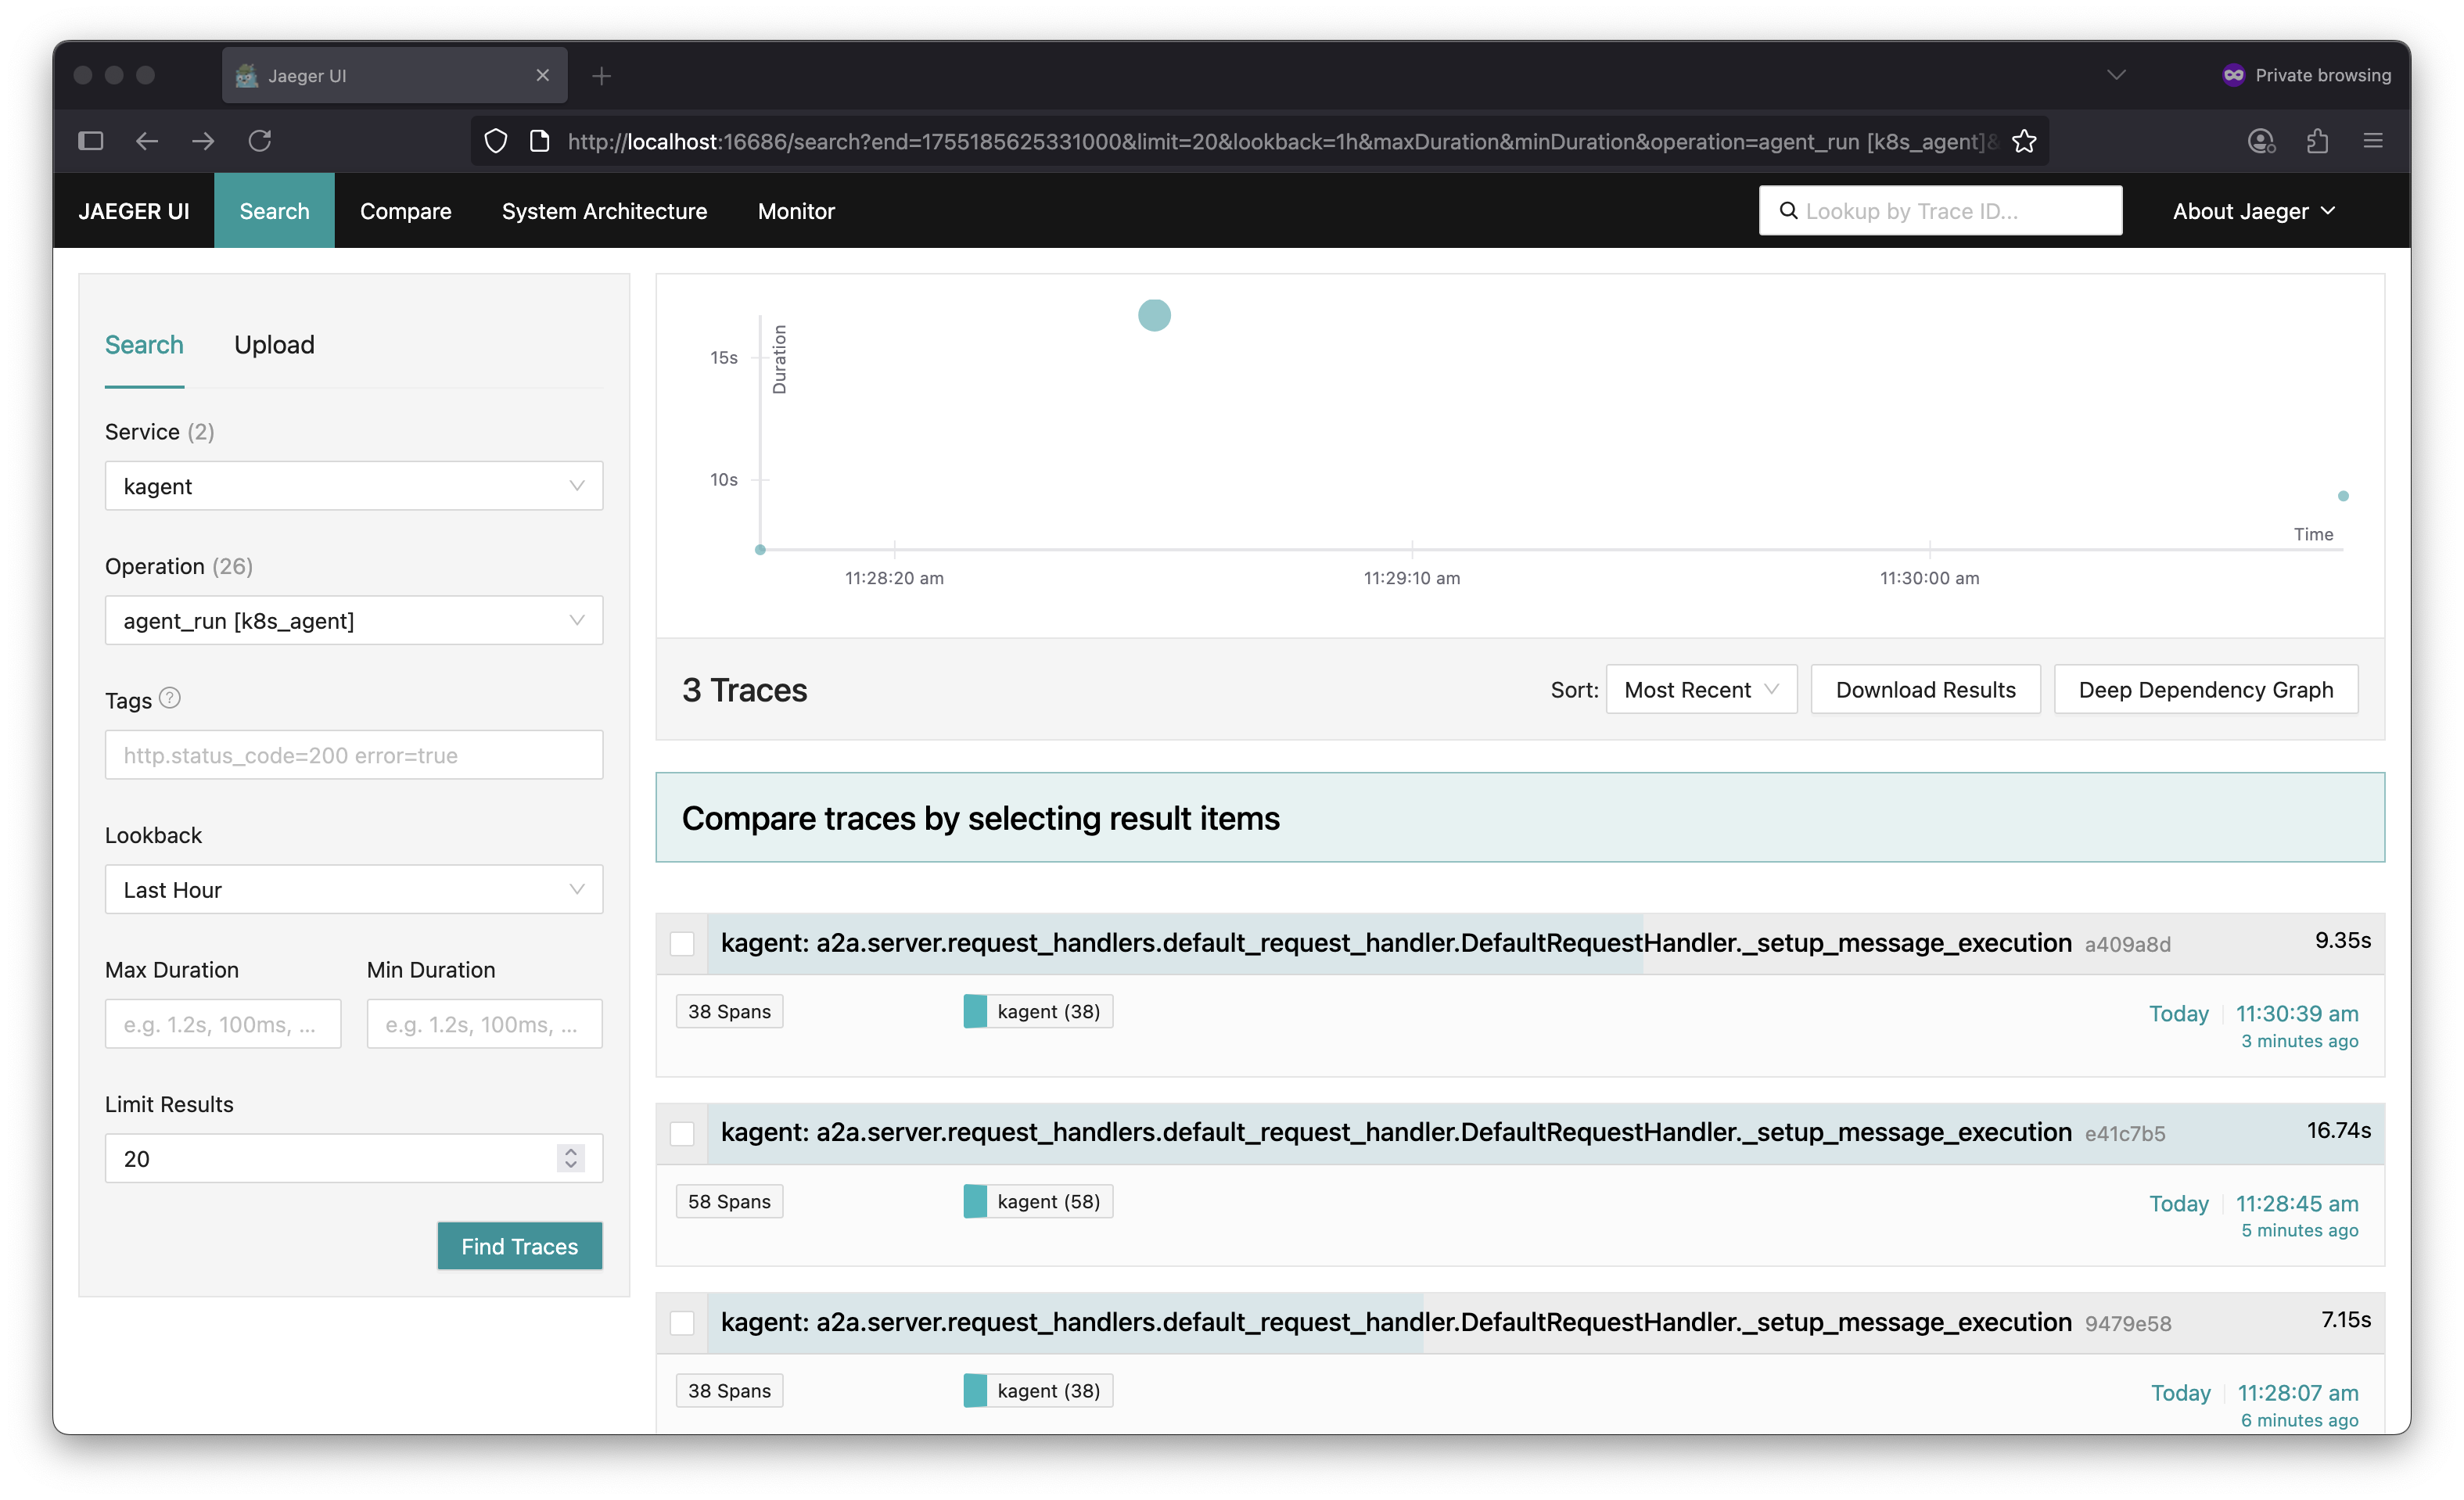
Jaeger results page Click on a trace to see more details.
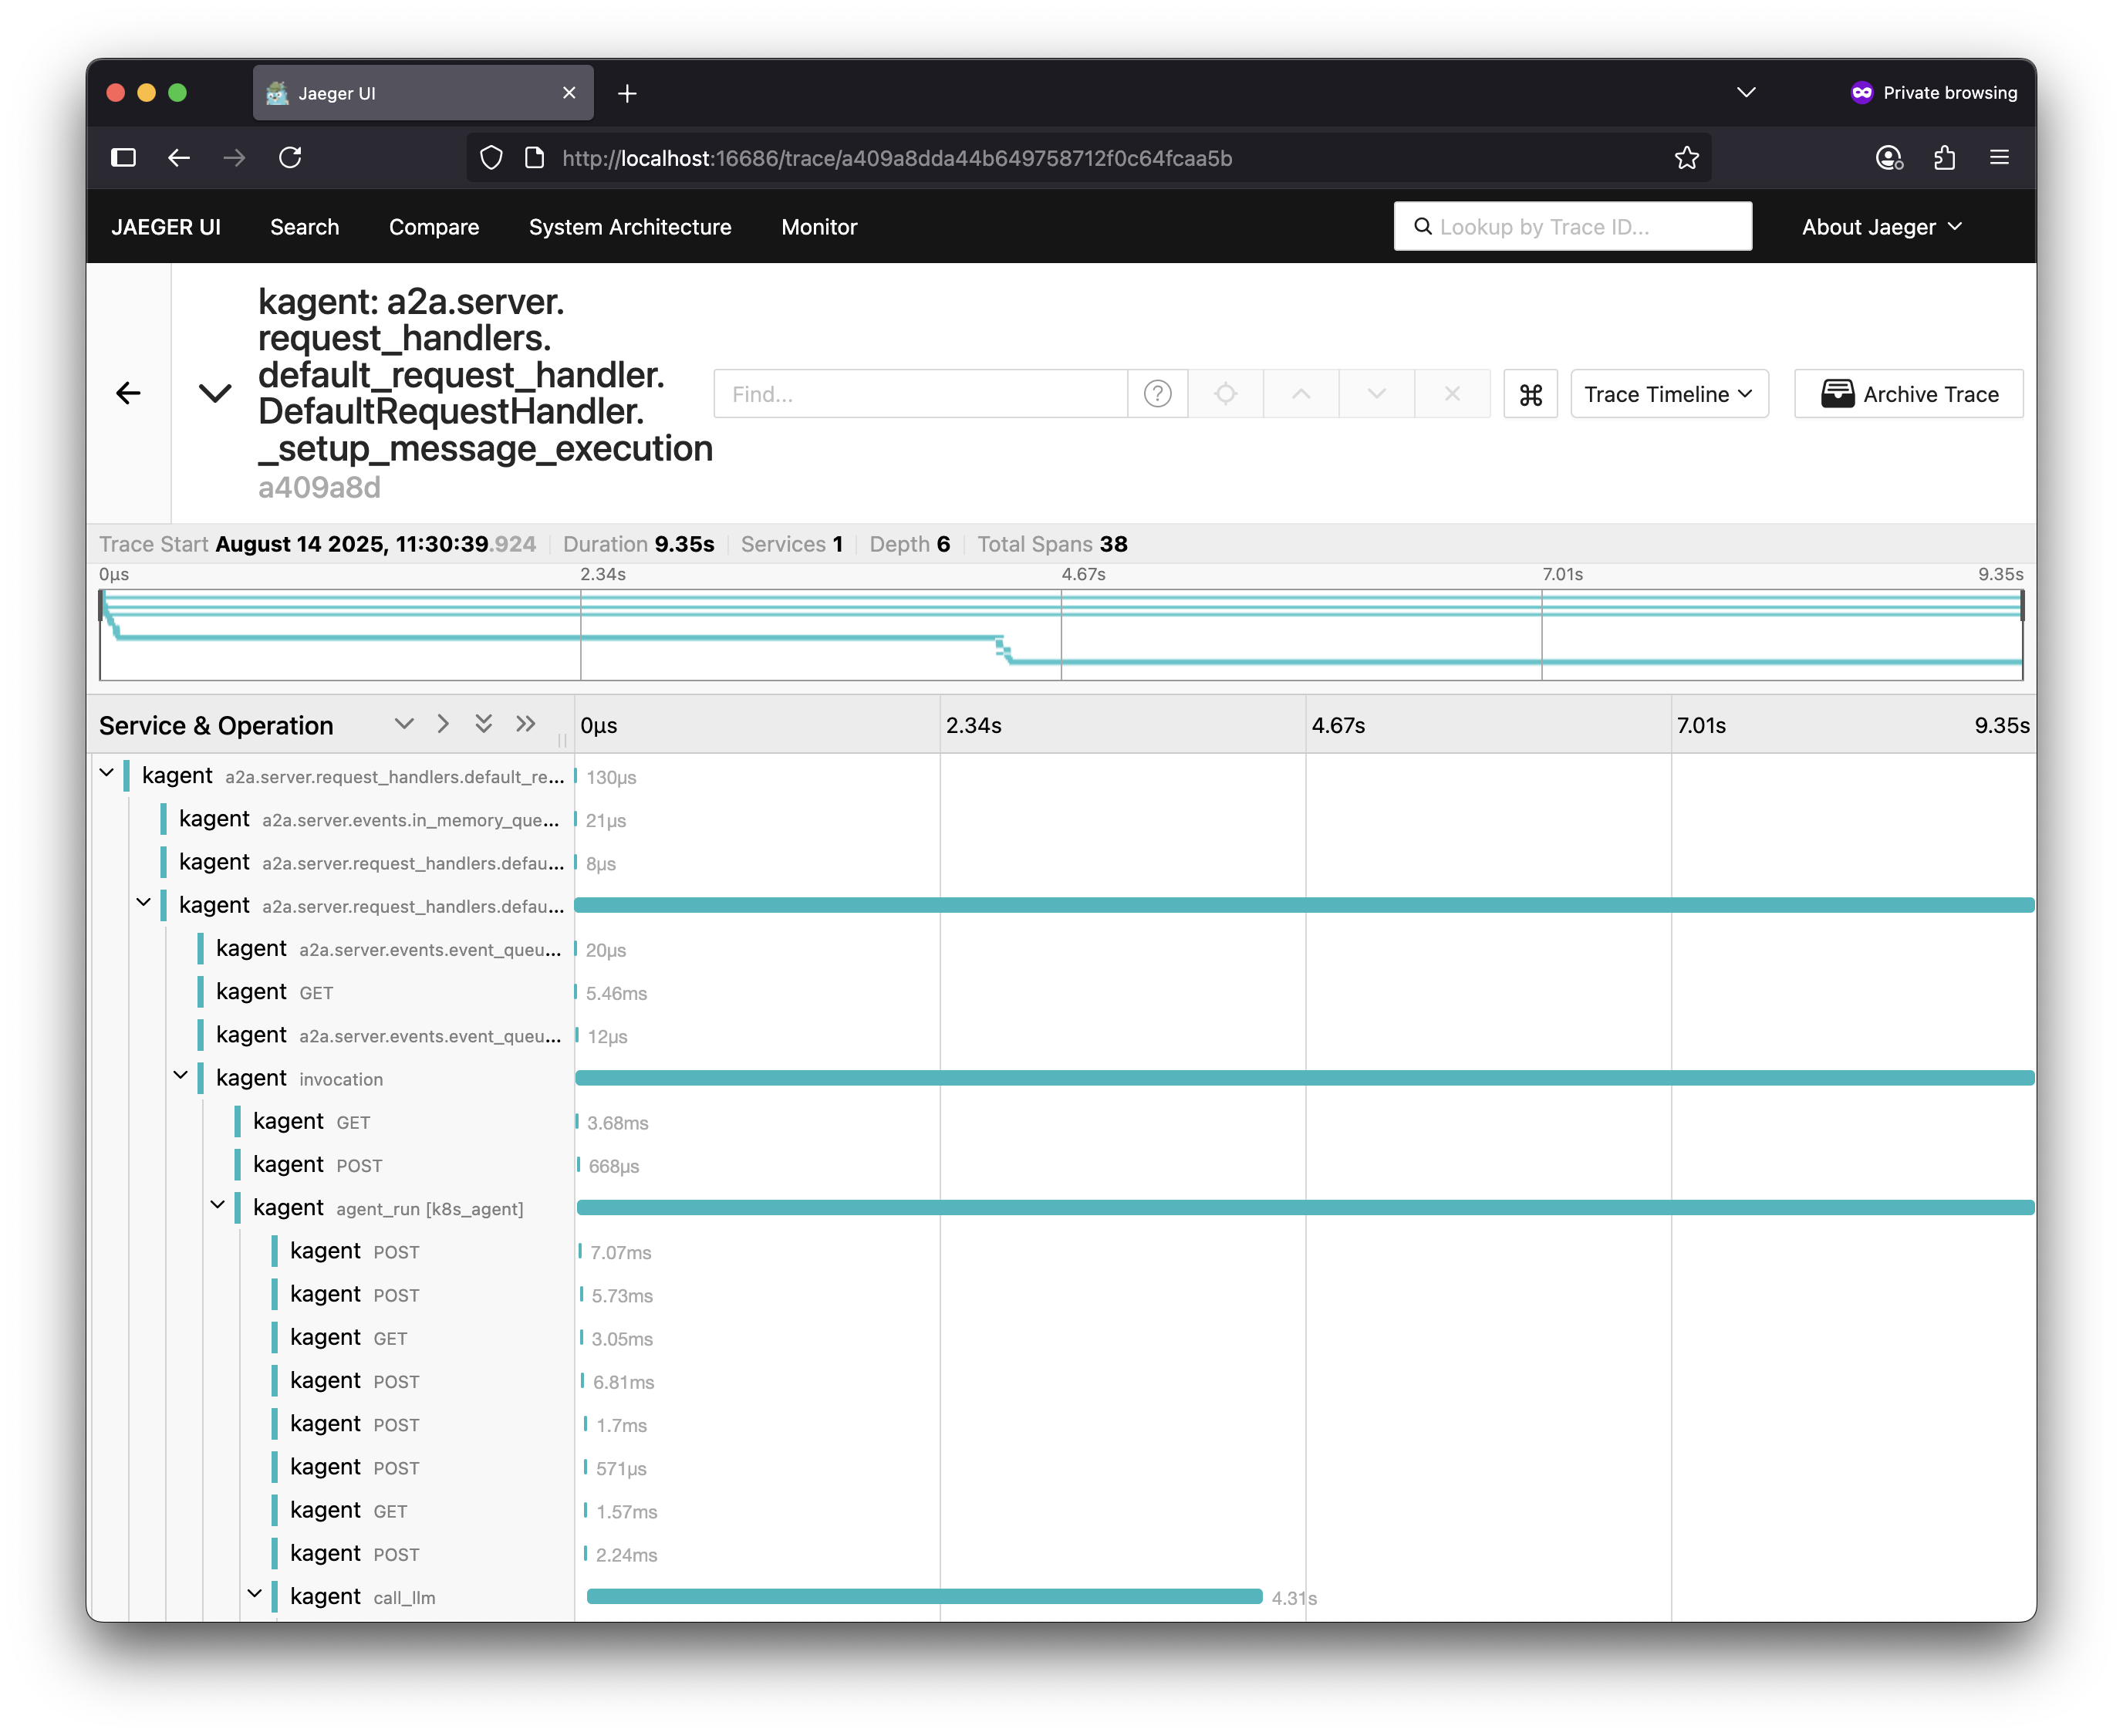
Jaeger trace details
That’s it! You’ve now traced your first agent.
Next Steps
- Learn about Core Concepts
- Try out some Example guides
Need Help?
- Visit our GitHub repository
- Ask a question on Discord
- Check out the FAQ